
Quick Answer:
A GPA conversion chart is a standardized reference table that translates academic grades from one country's grading system to another — typically to the US 4.0 scale. Because grading rigor varies significantly between countries (a 70% in the UK reflects exceptional performance, while it represents a C in the US), conversion charts adjust for this academic context rather than relying on direct mathematical translation.
Key Takeaways
- Direct arithmetic conversion between international grading systems is almost always inaccurate — context-aware bracket mapping is required.
- The US 4.0 scale is the international benchmark most commonly used for graduate admissions and multinational employers.
- Regional systems like the UK Honours classification, the Indian 10-point CGPA, and the European ECTS all require their own distinct conversion logic.
- Credential evaluators like WES (World Education Services) use proprietary, institution-level databases to perform accurate conversions for official applications.
- Self-calculated GPA estimates are acceptable for personal research and initial screening; official evaluations are required for formal admissions submissions.
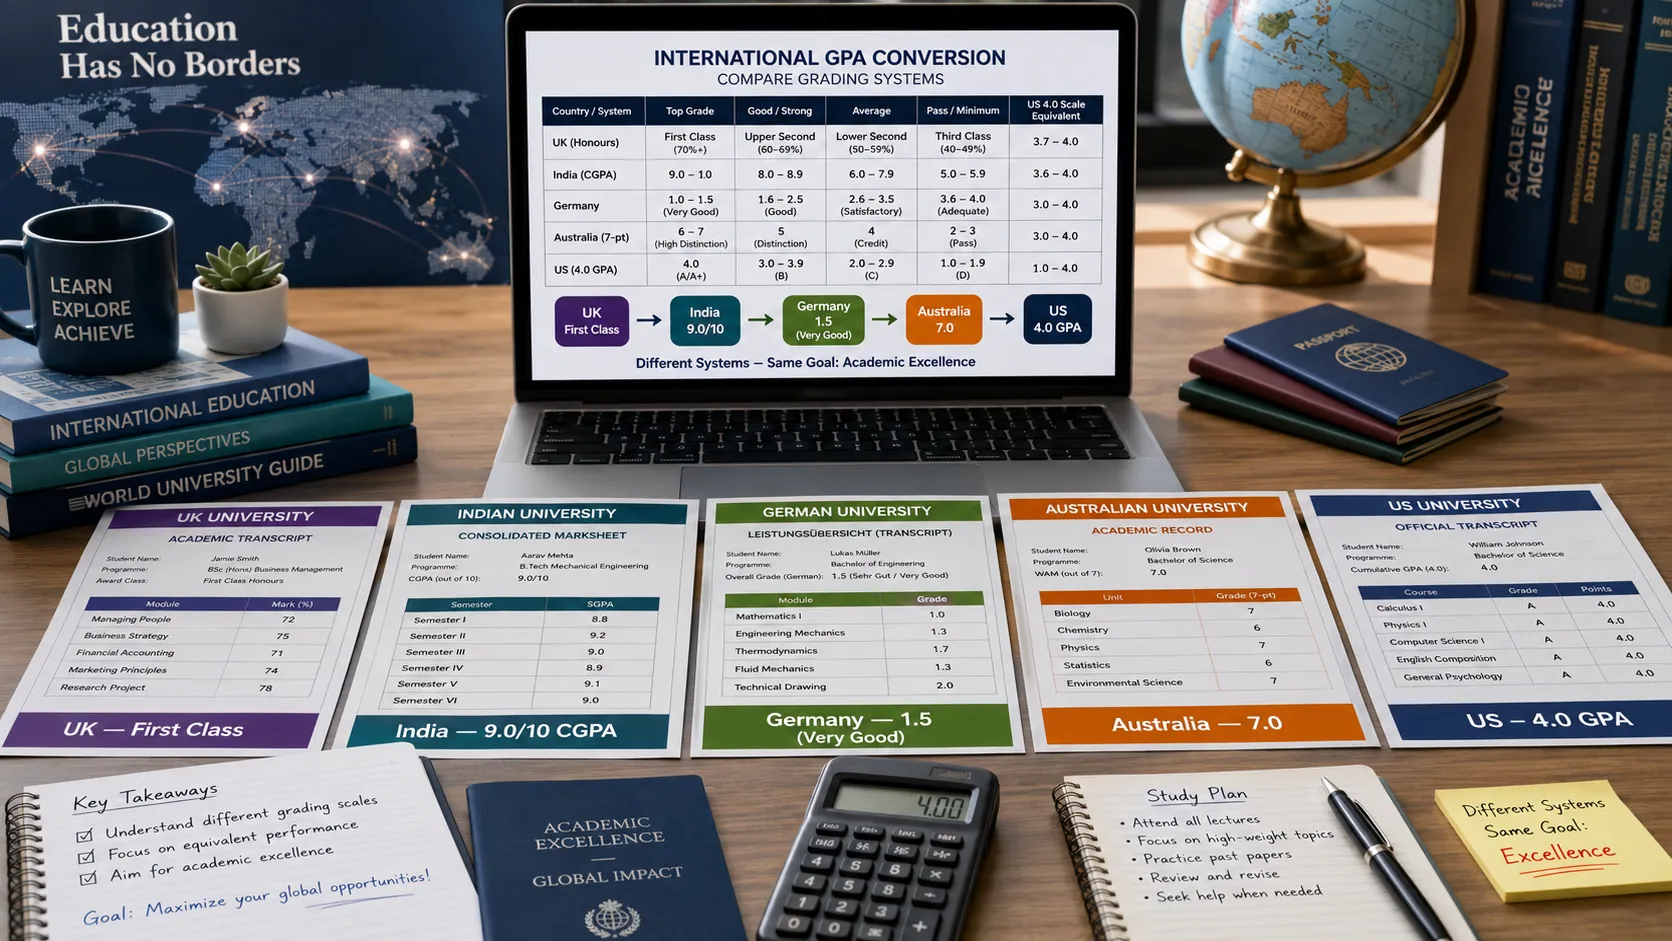
The Problem With a Fragmented Academic World
The global academic landscape has no single universal grading standard. A graduating student from the UK earns a "First-Class Honours" degree. A student from India earns a "9.2 CGPA." A student from Germany earns a "1.5" (where lower is better, a system that confuses most people encountering it for the first time). A student from Brazil earns an "8.7 out of 10."
When all four of these students apply to the same graduate program in the United States, the admissions committee must compare four completely different grading philosophies. This is not a trivial translation problem. These systems differ not just in their numerical scales but in their grading philosophy — how lenient or strict professors are, how many students are expected to score in the top tier, and what a "passing" grade actually represents.
GPA conversion charts exist to solve this. They provide a principled framework for mapping local grades onto a common benchmark, most commonly the US 4.0 scale, while accounting for known differences in grading culture.
Why Direct Mathematical Conversion Is Unreliable
The most instinctive approach is to divide your percentage by a fixed number to get a GPA. A student with an 80% might assume they have a 3.2 GPA (80 ÷ 25 = 3.2). This approach has two critical flaws.
Flaw 1: It ignores grading culture. In many Indian engineering universities, scoring above 80% places you in the top 5-10% of your cohort. In many US universities, 80% is a B — a completely average performance that might represent 40% of the class. The same number represents dramatically different levels of relative achievement.
Flaw 2: It ignores the floor. In the US, a 60% is a failing grade (often F or at best D). In many international systems, a 60% is a reasonable passing grade. If you divide 60 by 25, you get 2.4 — which on a US scale would suggest a C+ performance. But on a US scale, 60% is practically failing. The mathematical translation misrepresents the student's standing entirely.
The US 4.0 GPA Scale: The International Benchmark
Because so many international graduate programs (particularly in the US, Canada, and increasingly Australia) require a 4.0-scale GPA for applications, this scale has become the de facto international academic benchmark.
The unweighted US 4.0 scale maps percentage ranges to grade points as follows:
| Percentage Range | Letter Grade | GPA Points |
|---|---|---|
| 93% – 100% | A | 4.0 |
| 90% – 92% | A- | 3.7 |
| 87% – 89% | B+ | 3.3 |
| 83% – 86% | B | 3.0 |
| 80% – 82% | B- | 2.7 |
| 77% – 79% | C+ | 2.3 |
| 73% – 76% | C | 2.0 |
| 70% – 72% | C- | 1.7 |
| 60% – 69% | D | 1.0 |
| Below 60% | F | 0.0 |
This is a domestic US table. When applying it to international transcripts, these percentage cutoffs shift significantly based on the country and institution.
Regional GPA Conversion Charts Explained
The United Kingdom: Degree Classifications to 4.0
British universities use a degree classification system rather than a numerical GPA or percentage grade. The brackets are strict — achieving a First-Class Honours requires sustained performance above 70%, which in the British academic context represents genuinely exceptional work. Professors in the UK grade much more conservatively than their US counterparts.
| UK Degree Classification | Typical Percentage Range | US GPA Equivalent |
|---|---|---|
| First-Class Honours | 70% and above | 3.7 – 4.0 |
| Upper Second-Class (2:1) | 60% – 69% | 3.3 – 3.7 |
| Lower Second-Class (2:2) | 50% – 59% | 2.7 – 3.3 |
| Third-Class Honours | 40% – 49% | 2.0 – 2.7 |
| Pass (Ordinary Degree) | Below 40% | 1.0 – 2.0 |
India: 10-Point CGPA to 4.0 GPA
Indian universities under the UGC framework commonly use a 10-point CGPA scale. The WES conversion for Indian academic credentials to the US 4.0 scale follows a tiered mapping:
| Indian 10-Point CGPA | Approximate US 4.0 GPA |
|---|---|
| 9.0 – 10.0 | 4.0 |
| 8.0 – 8.9 | 3.7 |
| 7.0 – 7.9 | 3.3 |
| 6.0 – 6.9 | 3.0 |
| 5.0 – 5.9 | 2.0 – 2.5 |
| Below 5.0 | Below 2.0 |
If your Indian transcript shows a raw percentage rather than a CGPA, you can use our Percentage to GPA Converter for an initial estimate. For official applications, WES evaluates your specific institution's historical grading patterns.
Germany: The Inverted Scale
Germany's university grading system is famously counterintuitive for international observers. The scale runs from 1.0 to 5.0, where 1.0 is the highest possible grade (equivalent to a US A+) and 5.0 is a failing grade.
| German Grade | German Classification | US GPA Equivalent |
|---|---|---|
| 1.0 – 1.5 | Sehr Gut (Very Good) | 4.0 |
| 1.6 – 2.5 | Gut (Good) | 3.3 – 3.7 |
| 2.6 – 3.5 | Befriedigend (Satisfactory) | 2.7 – 3.3 |
| 3.6 – 4.0 | Ausreichend (Sufficient / Pass) | 2.0 – 2.7 |
| 4.1 – 5.0 | Nicht Bestanden (Fail) | 0.0 |
The median German university grade is approximately 2.3 — equivalent to a B on the US scale. Students applying from Germany should ensure conversion services understand the inverted nature of the scale.
Australia: The GPA System
Australian universities use a different variant of the GPA scale that can range from 4.0 to 7.0 depending on the institution. The most common is a 7-point scale:
| Australian Grade | Points | US 4.0 Equivalent |
|---|---|---|
| High Distinction (HD) | 7 | 4.0 |
| Distinction (D) | 6 | 3.7 |
| Credit (C) | 5 | 3.0 |
| Pass (P) | 4 | 2.0 |
| Fail (F) | 0 | 0.0 |
European ECTS: Credit-Based Grading
The European Credit Transfer and Accumulation System (ECTS) uses both a local percentage grading and an ECTS grade letter that describes where a student sits within the statistical distribution of their cohort.
| ECTS Grade | Definition | Approximate % of Students | US GPA |
|---|---|---|---|
| A | Excellent | Top 10% | 4.0 |
| B | Very Good | Next 25% | 3.3 – 3.7 |
| C | Good | Next 30% | 2.7 – 3.3 |
| D | Satisfactory | Next 25% | 2.0 – 2.7 |
| E | Sufficient | Bottom 10% (passing) | 1.0 – 2.0 |
| F | Fail | — | 0.0 |
When to Use a Conversion Chart vs. a Certified Evaluator
For Unofficial Purposes
Conversion charts are appropriate for:
- Checking your approximate eligibility before applying to a program
- Including an estimated GPA on an international resume or LinkedIn profile
- Personal academic goal-setting and planning
- Initial employer screening where a specific GPA format is not mandated
For Official Applications
You should not submit a self-calculated GPA for formal graduate school applications. Universities require certified evaluations from accredited organizations, including:
- WES (World Education Services) — The most widely recognized evaluator for US and Canadian applications. Provides document-by-document and course-by-course evaluations.
- ECE (Educational Credential Evaluators) — Another widely accepted NACES member with strong international coverage.
- NACES Members — Any member of the National Association of Credential Evaluation Services in the US maintains recognized professional standards.
These organizations access proprietary databases of institutional grading curves, faculty standards, and historical academic trends for thousands of universities worldwide. Their evaluations are not just mathematical conversions — they are informed assessments of academic equivalency.
The evaluation process typically takes 7 to 15 business days and costs $100 to $250 USD depending on the level of evaluation required.
Red Flags to Watch Out For
Red Flag 1: Free online "instant" evaluators claiming to produce certified reports.
No legitimate credential evaluation can be performed instantly. Reputable organizations require your actual transcripts and take days to process.
Red Flag 2: A chart that uses a single formula for all countries.
Any conversion tool that applies the same mathematical formula regardless of country of origin is not accounting for grading context. Results from such tools can be significantly off.
Red Flag 3: Ignoring grading scale footnotes on your transcript.
Many universities print their own grading scale on the reverse of the official transcript. This information is invaluable and should be included when submitting documents to an evaluation service.
Frequently Asked Questions (FAQ)
Can I convert my GPA to multiple international scales at once?
Yes. Our Percentage to GPA Converter supports multiple output scales, including the 4.0 US scale, the 10-point Indian CGPA, and common percentage equivalents.
Do conversion charts account for grade inflation?
Certified evaluation services try to — they maintain records of historical grading trends at specific institutions. General public conversion charts do not account for grade inflation and should be considered rough estimates only.
My GPA conversion resulted in a score below a program's minimum. Should I still apply?
Yes, if there are other strong elements to your application (research experience, work history, or exceptional test scores). Many programs note that minimum GPA requirements are guidelines, not absolute filters. A strong Statement of Purpose that addresses the GPA and highlights an upward academic trend can be persuasive.
Can I submit different conversions to different universities?
No. You should use the same certified evaluation report across all applications. Submitting different GPA values to different programs and being discovered inconsistent is considered misrepresentation.
conclusion
GPA conversion charts provide the essential bridge between academically fragmented national systems and a common international benchmark. The core insight to carry forward is that grading rigor differs dramatically between countries — meaning that the same percentage number carries a very different meaning depending on where it was earned. Always use region-appropriate conversion logic, not simple arithmetic, when estimating your international GPA. For formal applications, invest in a certified credential evaluation to ensure your academic record is represented accurately and accepted without question.
For a deeper explanation of how cumulative GPAs are built and what CGPA means for your career, read our guide on GPA vs SGPA vs CGPA Explained. If you are applying internationally, our guide on What is a Good CGPA for a Master's Abroad? will help you assess your competitiveness.